+7.2%
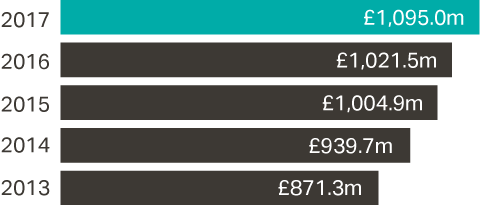
Underlying profit before tax*
£m
-7.5%
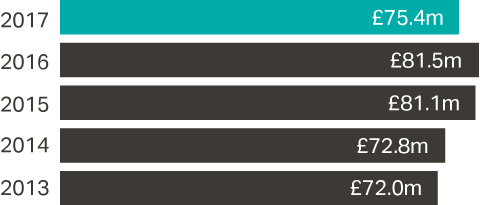
Profit before tax, after non-recurring items
£m
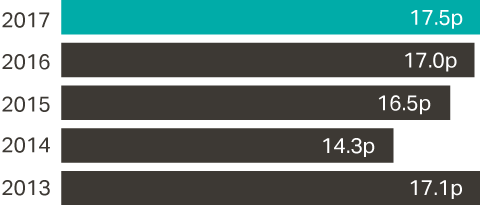
-10.5%
Dividend per ordinary share
pence
+3.0%
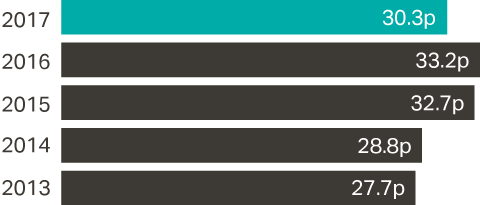
Underlying basic earnings per share*
pence
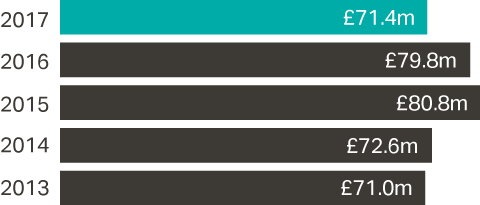
-8.7%
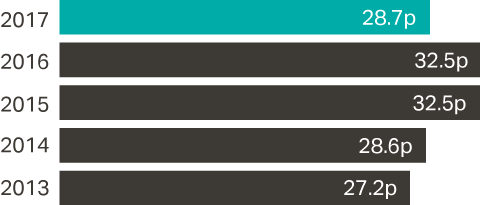
Earnings per share, after non-recurring items
pence
-11.7%
46%
Proportion of Retail sales matched to customers
11.1%
Service-related sales growth
Market share gains in the year in both Motoring and Cycling
30.5%
Total Group online sales growth**
0.8x
Net Debt to Underlying EBITDA ratio
Complementary M&A and investments across both of our key markets
* Alternative Performance Measures ("APMs"): Measures with this symbol are defined in the Key Performance Indicators table.
** Including the impact of the acquired Tredz & Wheelies. Excluding the acquired businesses, LFL Group online sales grew 11.5%.