Shareholder KPIs
Underlying profit before tax
Profit before income tax and non-recurring items as shown in the Group Income Statement.
The Board considers that this measurement of profitability provides stakeholders with information on trends and performance, before the effect of non-recurring items.
Underlying profit before tax declined by 7.5% year-on-year, primarily due to the depreciation of Sterling against the US dollar.
Underlying earnings per share
Profit after income tax and before non-recurring items as shown in the Group Income Statement, divided by the number of shares in issue.
EPS is a measure of our investment thesis and as such we aim to manage revenues, margins and invest in long term growth.
Underlying earnings per share declined by 8.7% year-on-year, primarily due to the depreciation of Sterling against the US dollar and small increase in tax rate.
Underlying EBIT & Underlying EBITDA
Underlying EBIT is results from operating activities before non-recurring items. Underlying EBITDA further removes Depreciation and Amortisation.
The Board considers that these measurements of profitability are a viable alternative to underlying profit and uses these measures to incentivise Management.
Underlying EBITDA declined by 5.1% year-on-year, primarily due to the depreciation of Sterling against the US dollar.
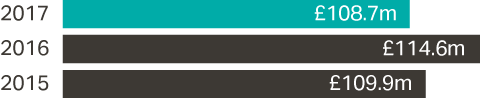
The above numbers represent Underlying EBITDA
Dividend per Ordinary Share
Cash returned to shareholders as a return on their investment in the Company.
To grow the dividend every year with cover of around 2x underlying earnings on average over time.
The Board has recommended a final ordinary dividend of 11.68 pence per share (FY16: 11.34 pence) which takes the full-year ordinary dividend to 17.51 pence per share, an increase of 3.0% on the prior year.
Net Debt
Current and non-current borrowings less cash and cash equivalents both in-hand and at bank as shown in the Consolidated Statement of Financial Position.
The Group remains strongly cash generative and continues to invest in the business. The Board is committed to maintaining an efficient balance sheet, returning any surplus capital not required to fund growth to shareholders. This measure helps to understand the financing structure of the Group.
Net Debt has increased by £38.0m to £85.9m, reflecting the acquisition of Tredz & Wheelies, investment in Tyresonthedrive.com and special dividend paid in February 2017.
Net Debt to Underlying EBITDA ratio
Represented by the ratio of Net Debt to Underlying EBITDA, both of which are defined above.
We target a ratio of 1x, with a range of up to 1.5x to allow for appropriate M&A. We will arrive at the debt target over time. This ratio helps to compare the financial result for the year to debt levels.
The Group had a Net debt to underlying EBITDA ratio of 0.8x at the end of FY17, up from 0.4x at the end of FY16, for the reasons explained in "Net Debt".
Like for like sales
Revenues from stores, Autocentres and websites that have been trading for at least a year (but excluding prior year sales of stores and Autocentres closed during the year) at constant foreign exchange rates.
Like for like sales is a widely used indicator of a retailer's trading performance, and is a comparable measure of our year-on-year sales performance.
A balanced result across both Retail and Autocentres. The negative like for like in the Car Enhancement category was attributable to declining sat nav sales (which equate to 3% of Group sales).
| FY17 LFL
revenue movement |
|---|
| Halfords Group | +2.7% |
| Retail | +3.1% |
| Motoring | +2.0% |
| Car Maintenance | +3.1% |
| Car Enhancement | -2.8% |
| Travel Solutions | +7.9% |
| Cycling | +5.1% |
| Autocentres | +0.6% |
Operational KPIs
Proportion of trained Retail colleagues
Measures the progress of our colleagues through the 3-Gears training programme.
We aim to have the majority of our colleagues trained to Gear 2 plus around two colleagues per store trained to the Gear 3 "guru" level.
By the end of the year nearly 70% of our eligible Retail store colleagues were qualified at Gear 2 level. We also have a further circa 10% of colleagues at Gear 3 level (equivalent to 1.2 per store).
The above numbers represent the proportion of colleagues qualified at Gear 2 level
Service-related Retail sales growth
Service-related sales is the income derived from the fitting or repair services themselves along with the associated product sold within the same transaction.
To grow service-related sales faster than total Retail sales growth.
Service-related sales grew by 11.1% in the year, with growth across the suite of our fitting and repair services.
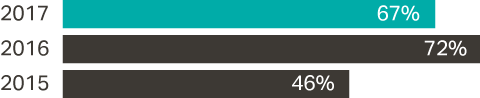
Proportion of Retail sales matched to a customer
The proportion of sales in Halfords Retail that can be matched to a specific customer in our database.
To increase our understanding of who our customers are. We will do this by adding to our customer databases and combing them to create a single customer view.
We can match 46% of Retail sales to customers, up from 15% this time last year.
Cycle Republic stores (cumulative)
The number of Cycle Republic stores that are trading.
We do not have a fixed store rollout target. However we have guided to open around 5 in FY18.
We opened 5 stores in FY17, in Purley, Birmingham, Leeds, Southampton and Edinburgh, taking the total to 15 at the end of the year.
Store and Autocentre refreshes
The number of Retail stores and Autocentres refreshed in the year.
We are committed to refreshing the design of our stores and Autocentres in order to improve the customer experience.
During the year we refreshed 17 Retail stores and 16 Autocentres.

The above numbers represent the number of Retail stores refreshed
Online sales as a proportion of total Retail sales
Online sales as a proportion of total Retail sales.
We are committed to improving our online shopping experience for customers.
Our online sales represented 14.8% of total Retail sales. This proportion was slightly higher in the year and reflects the addition of Tredz and Wheelies.